
Boris.T.Fedosov
Rudny Industrial Institute,
Rudny, Kazakhstan
About author
UDC 681.51.01
F338
Quality of linear automatic control systems or automatic regulation system (ARS) can be characterised an accuracy and fast response of their work in the transitive and steady regimes (established mode).
Both transitive and steady linear system operational modes can exist at submission of varying input actions on system. Difference consists that either input action, or its some low derivatives contain step changes in a transient regime. Some time after a jump of value of input action or its derivative, in system happens a transient phenomenon, and then, after its termination the system operates in a steady run before appearance of new jumps of input actions and their derivatives or before the commutations changing structure of the scheme.

Fig. 1.1. Structural diagram and transfer functions closed-loop automatic regulation system under the task and by error
Quality of the automatic control system in a transient regime is characterised by parametres of a transition function [1]. The model transition function - system response on a stage unit step input is simple for plotting for model in any simulator. It is necessary to determine only control time and the overcorrection characterising as a first approximation fast operation and an accuracy of the ARS.
Quality of the automatic control system in a steady run (established mode) can be characterised in error coefficients [2]. Error coefficients can be determined as coefficients of Taylor's series expansion of a transfer function of automatic control system Φ e ( s ) on an error stipulated by input action:
(1.1)

where: c0 - error coefficient on a position;
c1 - error coefficient on a speed;
c2 - error coefficient on an acceleration.
Then, obviously, the behaviour of an error of regulating in a time can be presented by series:
(1.2)

From (1.2) follows, that at the given admissible maximum error of regulating em, engaging of a principle of equal influence, coefficients determine:
- Xm - as much as possible maximum deviations max{x(t)} = Xm of a signal of the task acting on the automatic regulating system (ARS),
at which ARS ensures a required tracking accuracy: 
- max(dx/dt) - as much as possible maximum velocity of varying of a signal of the task (traced signal): 
- max(d2x/dt2) - as much as possible maximum acceleration of a signal of the task (traced signal): 
Thus, coefficients с0, с1 and с2 determine both an accuracy and fast-operation of system in a steady mode.
Traditionally error coefficients are determined by expansion of a transfer function of the automatic control system in Laurent series (by division of numerator of a transfer function into its denominator). In simulators rather simply to gain the response of the automatic control system to step function input action of a arbitrary power, and by the simple analysis of varying of errors of regulating in a time it is possible to gain and meanings of error coefficients.
Determination of error coefficients of regulating which we will illustrate on an instance of application of program VisSim, it is expedient to spend in the following order.
Determination of coefficient of error on a position с0:
The final value of an output signal of the summator of a main feed-back loop also is error coefficient on a position c 0.
Really, at time t tendency to ∞, i.e. upon termination of transient processes, an input signal x(t) = 1, and its derivatives x' (t) = 0 and x"(t) = 0. Therefore, as follows from (1.2), e(t) = c 0. High quality constant-error (static) systems have coefficient c 0 within 0,01 ... 0,1. For the zero-constant-error (astatic) systems having integrators in a loop, the coefficient c 0 is equal to null.
Exemple of determination of coefficient of an error on a position c 0 for the static automatic regulation system is displayed on fig. 2.1.1.
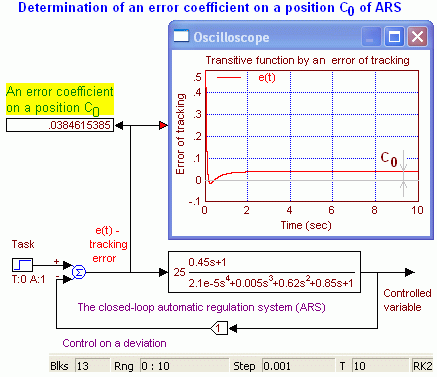
Fig. 2.1.1. Workspace of VisSim. The scheme of measuring of coefficient of an error on a position. An error coefficient on a position c 0 determination for a constant-error (static) system. Value of coefficient is equally final value of regulating error
We will mark, that though there is enough to know for practical usage value c 0 with an accuracy in two - three significant digits. But that further, in program VisSim, it is enough to specify values of coefficients c 1 and c 2 it is necessary to estimate a value coefficient c 0 with an accuracy 6... 8 significant digits. It is easy for making, scaling oscillograms - selecting its segment the left-hand mouse button and holding thus a control (CTRL) key though it is more convenient to use the digital indicator (display).
Determination of error coefficient on the speed с1 is expedient for executing as follows. To substitute in the previous scheme step input action on linearly growing input action (ramp): x(t ) = t∙10(t), где 10(t) - Heaviside's unit step-function. Having a kview, that upon termination of a transient process, x'(t) = 1, x''(t ) = 0 and considering (1.2) we will gain:
(2.2.1)
![]()
From here
(2.2.2)
![]()
As it is visible, for с1 value obtaining follows from an error final value e(t) to subtract linearly growing value c0t, defining relation of a final value of an error to value of a signal. The scheme and the oscillogram of an exemple of determination of error coefficient on the speed is brought on fig.
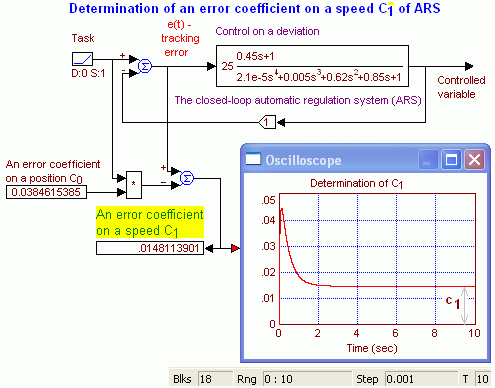
Fig. 2.2.1. Determination of error coefficient on the speed c1. Value of an error, numerically equal to coefficient c1, it is necessary to determine upon termination of a transient process
It is possible to judge sufficient level of accuracy of determination of coefficient с0 under the oscillogram fig. 2.2.1. If this coefficient is preset insufficiently precisely upon termination of the transient process well watched on the oscilloscope, the oscillogram graph on fig. 2.2.1 will decrease or increase. For elimination of it, it is possible to return to the scheme fig. 2.1.1 and there to update value с0. Refinement can be lead and selection of this value in the scheme fig. 2.2.1, achieving that the graph of the transient process transited horizontally on an interval of time considerably exceeding transient time.
Determination of coefficient of an error on an acceleration с2 we will execute as follows. On the researched automatic regulation system (ARS) it is necessary to give a parabola:
(2.3.1)

Upon termination of a transient process derivatives will become: x'(t) = t, x''(t) = 1, and a highest derivative power for all k k > 2 is equal to null: x(k)(t) = 0. Thus, in a steady regim expression (1.2) for an error will become:
(2.3.2)

From here can be discovered value c2:
(2.3.3)

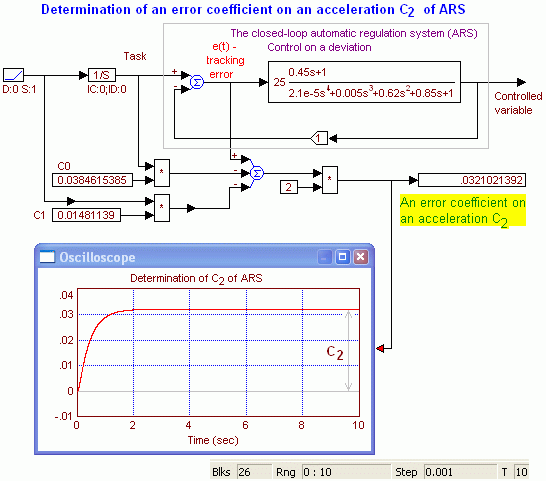
Fig. 2.3.1. The scheme for determination of an error coefficient on an acceleration с2 of automatic regulation system (ARS) and the oscillogram with a coefficient indicated value. Parabolical input forms the integrator by integrating linearly growing signal
The scheme fig. 2.3.1 allows to update values of low error coefficientses if necessary. For criterion here, as well as the request of horizontal position of the plot during time, considerably, in 10 - 100 times, exceeding transient time.
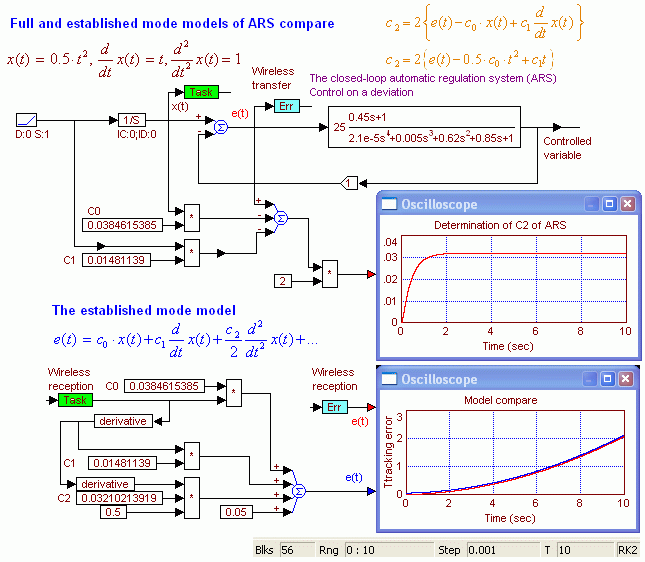
Fig. 2.3.2. Validation of determination of error coefficientses. On the lower oscillogram are resulted: an error signal e(t) it is immediate from model of automatic regulating system (ARS) (a red curve) and the error signal computed by means of error coefficientses gained before values (a dark blue curve). The second plot is raised on 0,05 as a matter of convenience matchings and compare of curves. Apparently, they coincide, that testifies to correctness of determination of error coefficientses. At the given input action and an observation interval the main contribution to an error imports addend with error coefficient on a position с0.
Let's mark, that selection of VisSim integration method in the given exemple affects on result of determination of error coefficientses a little.
As follows from (1.1), error coefficientses can be gained and Taylor's series expansion of a transfer function of the automatic regulating system (ARS) on an error stipulated by the input task. More low, for matching with VisSim's outcomes expansion is spent in program Mathcad 2000:

Apparently, for the observed exemple, coefficients с0 and с2 coincide in both programs with an accuracy above four significant digits, and the coefficient с1 coincides only with an accuracy in three significant digits, that however it is quite enough for practice, but, nevertheless, characterises also an accuracy, accessible in programs. Not always the long line of digits in number testifies to its real accuracy.
The exemple of determination of error coefficientses for a zero-constant-error (astatic) system with the first order of a servo system type number is brought on fig. 3.1. The model is gained from the previous model by PI-regulator adding. Integrator presence in a loop ensures equality to null of coefficient of an error с0.
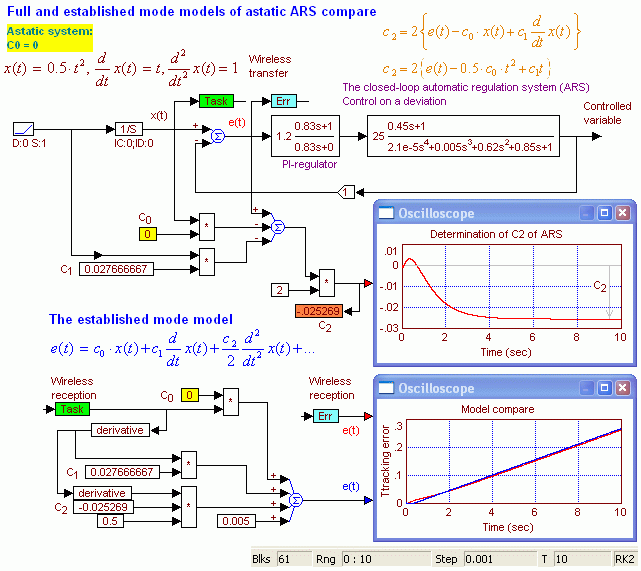
Fig. 3.1. Schemes for determination of error coefficient on an acceleration с2 of astatic automatic regulating system (ARS) and validation of determination of error coefficientses. The dark blue curve on the lower oscillogram is uplifted on value 0,005 as a matter of convenience matchings of values of errors. Apparently, upon termination of a transient process, approximately through 3 sec, value of an error e(t), determined by means of error coefficientses grows linearly, as well as it is necessary at parabolical input action on first order number type a servo system (astatic), and coincides with a model error
Let's mark, that in the second exemple, in case of a zero-constant-error system (astatic), the outcome of determination of coefficient c 2 depends on an integration method, than in the first more essentially.
Along with power input action by the important characteristic signal supporting a steady regim of work of the automatic regulating system (ARS), the sine-wave signal is. Quality of work of the ARS in the conditions of affecting on it of a sine-wave signal is useful to characterise an amplitude-frequency characteristic (AFrCh) of the ARS on the same channel of the error stipulated by the task. Unfortunately, for today program VisSim 3 abnormally scales graphics at passage from logarithmic scale to natural scale. In such situation it is possible to apply various alternative ways of plotting of the AFrCh from which the most simple in implementation is application of a signal with the linear frequency modulation (LFrM). The outcome here is represented in not so refined form, but for practical purposes suits.
On fig. 4.1 the scheme for plotting of the AFrCh with usage LFrM (Linear frequency modulation) signal and the oscillogram of error signals of regulating and an ARS (automatic regulatoring system) output signal is displayed. The lower input of the oscilloscope is for scan making on frequency (it is necessary to deliver a tick "XY plot" in properties of the oscilloscope).
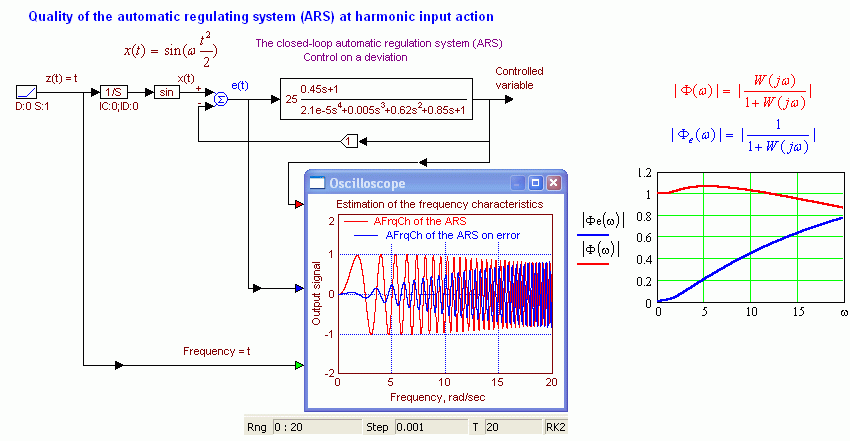
Fig. 4.1. Usage of the LFrM (linear frequency modulation) of a signal for plotting of the AFrCh (amplitude-frequency characteristics) of the ARS (automatic regulatoring system). Enveloping a frequency-modulated signal also represent amplitude-frequency characteristics (AFrCh). The same characteristics plotted in program Mathcad 2000 are displayed on the right for matching
Apparently on fig. 4.1, the signal amplitude of an error reaches the considerable values already when value of an output signal is reduced still inappreciablly. It is stipulated by that transfer functions are linked by a coefficient:
(4.1)
![]()
For criterion of fast operation of the ARS at usage of the AFrCh of the ARS the frequency limit on which the reinforcement makes 0,707 initial can be. For the scheme fig. 4.1 it approximately 20 rad/sec. Signals of arbitrary form, which spectrum is bounded above by frequency, smaller than boundary, ARSes (automatic regulatoring systemes) with a satisfactory accuracy will be operated.
ARS (automatic regulatoring system) error coefficientses characterise its accuracy and fast operation in a work steady regim at an optimisation of power input actions. As any smooth affecting can be decomposed in a power series error coefficientses can characterise quality of the ARS (automatic regulatoring system) and at an arbitrary signal, allowing to determine regulating dynamic errors.
ARS error coefficientses can be determined in simulators as the established fixed values of tracking errors at power input actions of various orders. An accuracy of determination of values of low error coefficientses for obtaining of valid value of high coefficient should be enough high: 6... 8 signs.
Quality of the ARS at an optimisation of harmonic input action is characterised the AFrCh (amplitude-frequency characteristics) of the ARS on the channel of the error stipulated by the task or a disturbance. The AFrCh can be plotted with usage of a sine-wave signal with the linear frequency modulation.
Considering some singularities and defects in general good programs VisSim, for confidence of outcomes, it is expedient to spendand monitoring calculations in other simulator or in Mathcad.
Methods of determination of the error coefficientses, applied in the given article, can be used and for determination of coefficients of the response which allow to simulate the ARS (automatic regulatoring system) in a steady regim [5].
8/07/2003 - 03/27/2011