Boris.T.Fedosov
Rudny Industrial Institute,
Rudny, Kazakhstan
About author
UDC 681.51.01
аЄ338
This article examines simple, but effective receptions of an evaluation and the mappings of frequency characteristics which are allow essentially speed up run time.
Naturally-logarithmic form of the representation of Michailov's and Nyquist's hodographs is offered, allowing to present compactly the hodograph in a very wide frequency band with saving of a correct mapping of arguments
Frequency characteristics are widely used is the ACTh (Automatic control theory), electronics, a radio-engineering and other scientific and technical disciplines for the analysis and synthesis of control systems, electrical and electronic circuits. Thus it is important to present them in a way they are evident and allow to represent properties of system in a broad band of frequencies, but also to compute fast.
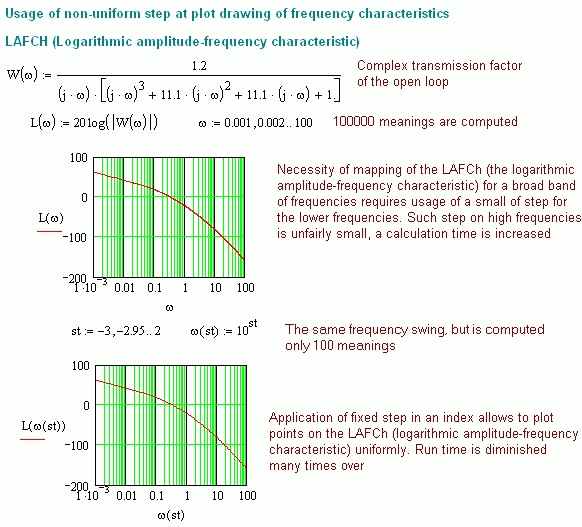
For an acceleration of graph plotting of the LAFCh (logarithmic amplitude-frequency characteristic) and a LPhFCh (logarithmic phase-frequency characteristic) in a Mathcad, it is expedient to use non-uniform (irregular) step, setting fixed step in an exponential function index.
LAFCh (logarithmic amplitude-frequency characteristic)

Fig. 1. Reduction of a computing time and a graph plotting of the LAFCh (Logarithmic amplitude-frequency characteristic) using a nonuniform step varying under the exponential law. In the given example the number of computed meanings is decreased in 1000 times with saving of a LAFCh (logarithmic amplitude-frequency characteristic) graph plotting accuracy
LPhFCh (logarithmic phase-frequency characteristic)
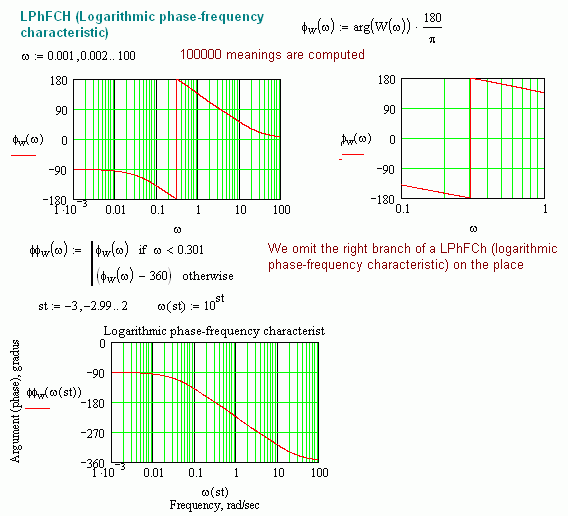
Fig. 2. The Mathcad computes principal values of argument of a complex transmission factor (CTF). To make the LPhFCh (logarithmic phase-frequency characteristic) to look as usual it is necessary to omit its right part on 3600
Dr., professor of sub-faculties of automatic control systems Nikolay Nikolaevich Makarov (Tula State University) has kindly suggested that it is possible to plot LPhFCh (logarithmic phase-frequency characteristic) without using of Mathcad programming. The solution was offered by student of Nikolay Nikolaevich, Yesipov Alexander Nikolaevich. As hundreds students found this solution, it, by word Nikolay Nikolaevich, already became though popular.
Let's set the array of frequencies with length n for which the phase will be computed. We will change frequencies in the array not linearly, but under the logarithmic law in a such a way that points uniformly placed on a logarithmic scale
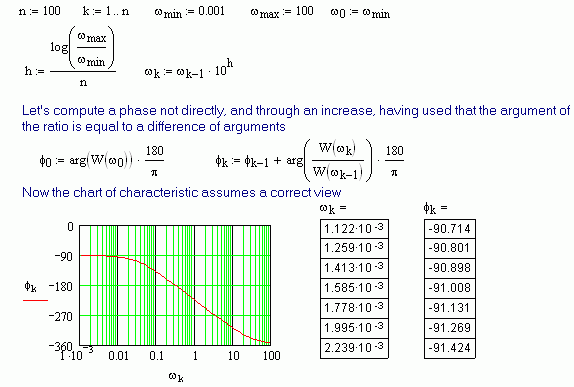
Fig. 2a. A computation and graph plotting of the PhFCh (phase-frequency characteristic) through an increment of arguments
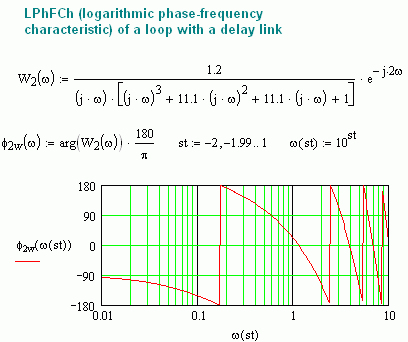
3. Omit self-maintainedly LPhFCh (logarithmic phase-frequency characteristic) sections on the places. Generally for this purpose it is necessary to write the program for φ 2w (ω) in Mathcad language
The alternative way of graph plotting applied on sub-faculty of automatic control systems of the Tula state university:
Let's set the array of frequencies in length n for which the phase will be computed. Frequency in the array we will change not linearly, and under the logarithmic law that points uniformly placed on a logarithmic scale
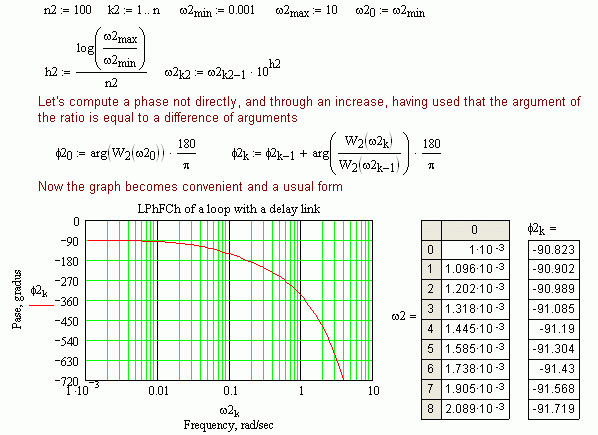
Fig. 3a. A computation and graph plotting of the PhFCh (phase-frequency characteristic) of a loop which has a delay link through an increment of arguments (phase)
VisSim sometimes displaces a LPhFCh (logarithmic phase-frequency characteristic) up.
At graph plotting of a LAFCh (logarithmic amplitude-frequency characteristic) and LPhFCh (logarithmic phase-frequency characteristic) of the automatic control system which has a delay link in a loop VisSim this link does not consider.
Programm complex "MBTY" is drawn the graph of the logarithmic amplitude-frequency characteristic in the classical form:
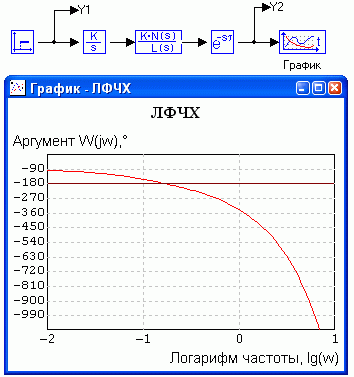
Fig. 4. A LPhFCh (logarithmic phase-frequency characteristic) of a loop which has the delay link, drawn in the Programm complex MBTY. It is not a frequency on a horizontal axis, but its log that is not so convenient
More often to observe behaviour of the hodograph in broad frequency band, it is necessary to draw it graph in various scales:
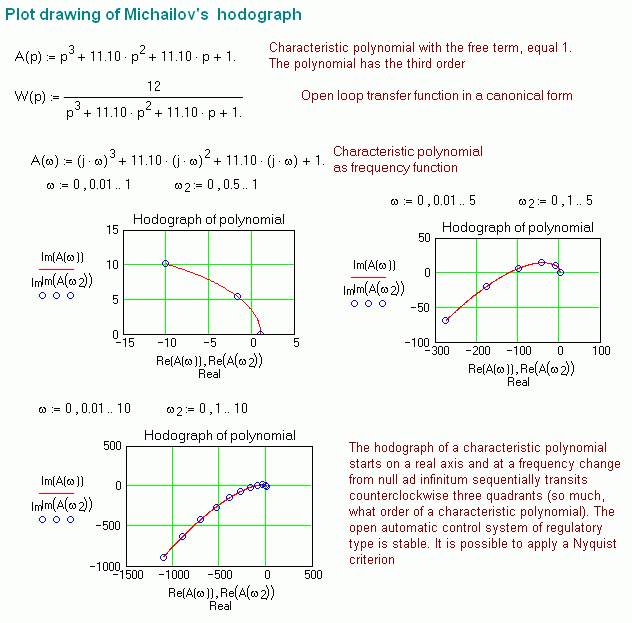
Fig. 5. For mapping of behaviour of the hodograph of the Michailov it is necessary to draw it graph in different scales
At graph plotting of the Michailov's hodograph is important to map its behaviour correctly in regions of axes interception, and also its tendency to infinite.
These tasks solve a modification under the logarithmic law of the module of the function which hodograph is plotting, outside of a round of radius 2 unities which centre in a coordinate's origin. In this round a natural scale is saved, and on a round lines do a conjunction:
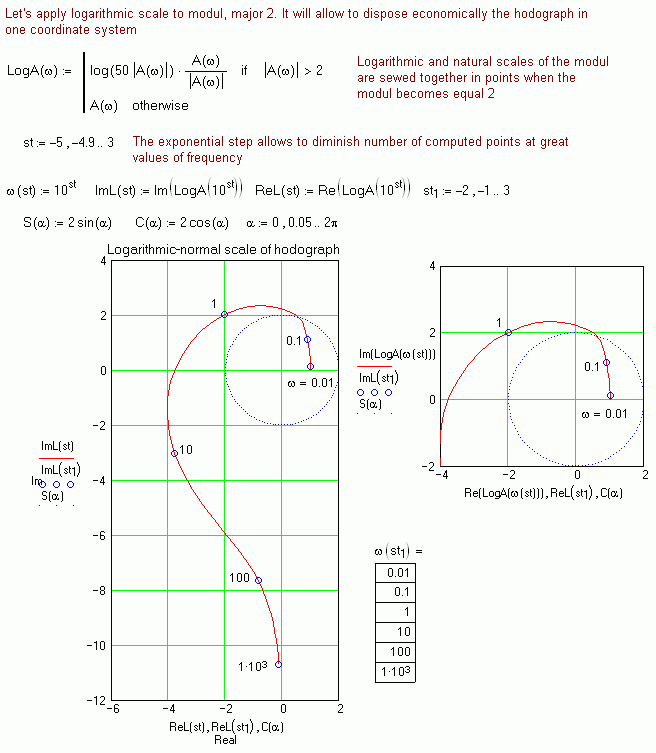
Fig. 6. The hodograph of the Michailov (the hodograph of a characteristic polynomial of the automatic control system). Representation of the module of a characteristic polynomial outside of a circle having 2 unities radius in logarithmic scale allows to display a behavior of the hodograph for very broad frequency swing. In particular, here it is well visible, that the hodograph of system of the third order at frequency tendency to infinite gravitates asymptotic to an imaginary axis, i.e. the argument really varies on -2700, that it is difficult to see and experience on the graph plotted in natural scale (see fig. 5).
Graph plotting of the Nyquist's hodograph (the hodograph of a complex transmission factor (CTF) of the open loop of the automatic control system) it is important correctly to map into angles (arguments CTF), and also to map behaviour of the hodograph when modules CTF are great, for example, when there are integrators in a loop, at the frequency aimed to null.
To observe behaviour of the hodograph in broad frequency band, it is necessary to draw it's graph in different scales:
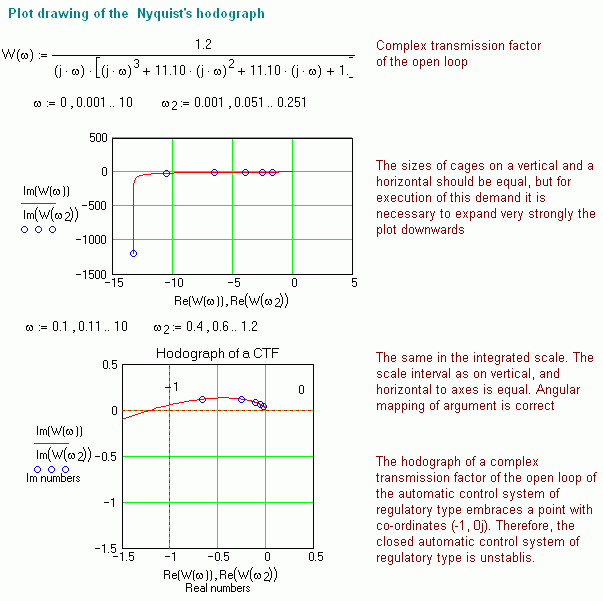
Fig. 7. The hodograph of a complex transmission factor (CTF) of the open loop of the automatic control system is plotted in natural scale
Usage of logarithmic scale for module CTF outside of a round of radius 2 allows to present rationally the hodograph, saving correct mapping of argument (phase) CTF:
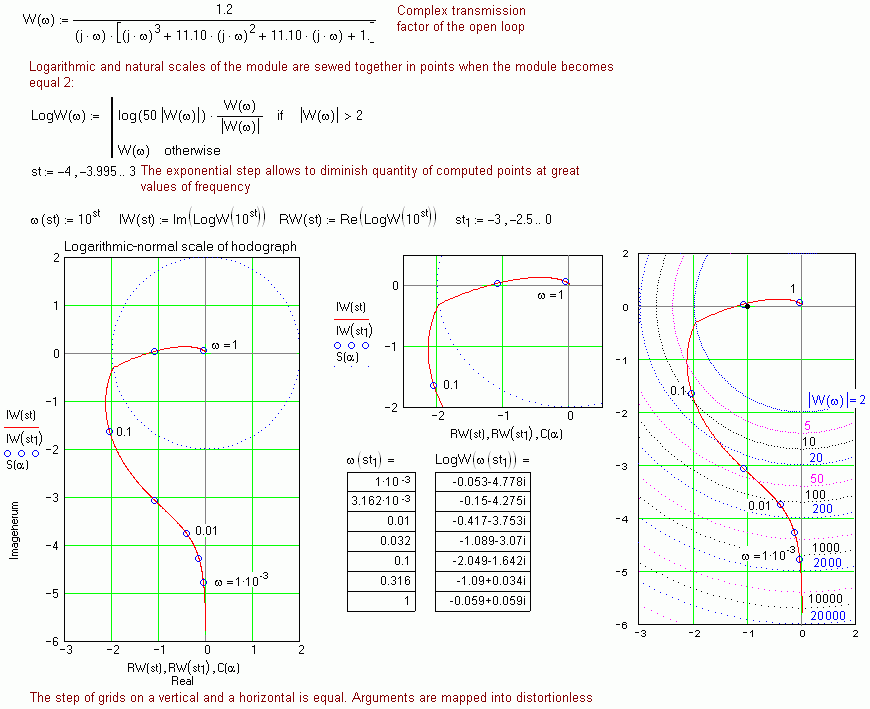
Fig. 8. Hodograph CTF is plotted in natural scale within a round having radius equal 2, and in logarithmic scale outside of a circle. The frequency band is very wide and simultaneously mapping of argument of the CTF (complex transmission factor) is yielded correctly
Two simple receptions: usage of non-uniform step and logarithmic scale outside of a round of radius 2, allows to speed up run time and to represent on graphics behaviour of frequency characteristics in broad frequency band.
04/10/2006
Adding 02/20/2009 - 01/17/2011